API Features
This notebook demonstrates the new API features added in epimodels v0.5.3:
to_dataframe()- Export results to pandas DataFrameto_dict()- Get a copy of simulation tracessummary()- Get epidemic summary statisticscopy()- Create a copy of the modelreset()- Clear simulation resultsR0property - Basic reproduction numberParameter validation
[1]:
from epimodels.continuous import SIR, SIS, SEIR, SIRS
from epimodels.discrete import SIR as DiscreteSIR
from epimodels import ValidationError
import matplotlib.pyplot as plt
Basic Reproduction Number (R0)
The R0 property returns the basic reproduction number for the model. It’s calculated from the model parameters after running a simulation.
[2]:
model = SIR()

# R0 is None before running the model
print(f"R0 before simulation: {model.R0}")

# Run the model
model([1000, 1, 0], [0, 100], 1001, {'beta': 0.3, 'gamma': 0.1})

# Now R0 is available (beta/gamma = 3.0)
print(f"R0 after simulation: {model.R0}")
R0 before simulation: None
R0 after simulation: 2.9999999999999996
R0 for different models
The R0 property is available for SIR, SIS, SEIR, and SIRS models.
[3]:
# SIS model
sis = SIS()
sis([1000, 1], [0, 50], 1001, {'beta': 0.5, 'gamma': 0.25})
print(f"SIS R0: {sis.R0}")

# SEIR model
seir = SEIR()
seir([1000, 0, 1, 0], [0, 50], 1001, {'beta': 0.4, 'gamma': 0.2, 'epsilon': 0.1})
print(f"SEIR R0: {seir.R0}")

# SIRS model
sirs = SIRS()
sirs([1000, 1, 0], [0, 50], 1001, {'beta': 0.6, 'gamma': 0.3, 'xi': 0.05})
print(f"SIRS R0: {sirs.R0}")
SIS R0: 2.0
SEIR R0: 2.0
SIRS R0: 2.0
Summary Statistics
The summary() method returns key epidemic statistics from the simulation.
[4]:
model = SIR()
model([1000, 1, 0], [0, 100], 1001, {'beta': 0.3, 'gamma': 0.1})

stats = model.summary()
print("Epidemic Summary:")
for key, value in stats.items():
    print(f"  {key}: {value:.2f}" if isinstance(value, float) else f"  {key}: {value}")
Epidemic Summary:
  model: SIR
  t_start: 0.00
  t_end: 100.00
  peak_I: 298.70
  peak_time: 37.05
  final_S: 60.75
  final_R: 936.14
  attack_rate: 0.94
Understanding the statistics
peak_I: Maximum number of infectious individuals
peak_time: Time at which peak I occurs
final_S: Final susceptible count
final_R: Final removed (recovered) count
attack_rate: Proportion of population that was infected
Export to DataFrame
The to_dataframe() method exports simulation results to a pandas DataFrame for easy analysis.
[5]:
model = SIR()
model([1000, 1, 0], [0, 50], 1001, {'beta': 0.3, 'gamma': 0.1})

df = model.to_dataframe()
print(f"DataFrame shape: {df.shape}")
print(f"Columns: {list(df.columns)}")
df.head()
DataFrame shape: (10, 4)
Columns: ['S', 'I', 'R', 'time']
[5]:
| S | I | R | time | |
|---|---|---|---|---|
| 0 | 1000.000000 | 1.000000 | 0.000000 | 0.000000 |
| 1 | 999.995758 | 1.002827 | 0.001416 | 0.014135 |
| 2 | 999.952671 | 1.031536 | 0.015792 | 0.155485 |
| 3 | 999.447946 | 1.367801 | 0.184253 | 1.568989 |
| 4 | 996.610788 | 3.256427 | 1.132785 | 5.924102 |
[6]:
# DataFrame allows easy analysis
print(f"Max I: {df['I'].max():.1f}")
print(f"Time of peak: {df.loc[df['I'].idxmax(), 'time']:.1f}")
print(f"Final R: {df['R'].iloc[-1]:.1f}")
Max I: 298.7
Time of peak: 37.0
Final R: 667.8
Copy and Reset
Copy a model
[7]:
model = SIR()
model([1000, 1, 0], [0, 50], 1001, {'beta': 0.3, 'gamma': 0.1})

# Copy without results
new_model = model.copy(include_traces=False)
print(f"Original traces: {len(model.traces)}")
print(f"Copy traces: {len(new_model.traces)}")

# Copy with results
full_copy = model.copy(include_traces=True)
print(f"Full copy traces: {len(full_copy.traces)}")
Original traces: 4
Copy traces: 0
Full copy traces: 4
Reset a model
[8]:
model = SIR()
model([1000, 1, 0], [0, 50], 1001, {'beta': 0.3, 'gamma': 0.1})
print(f"Before reset: {len(model.traces)} traces")

model.reset()
print(f"After reset: {len(model.traces)} traces")

# Can run again with different parameters
model([500, 5, 0], [0, 30], 505, {'beta': 0.4, 'gamma': 0.2})
print(f"After re-run: {len(model.traces)} traces")
Before reset: 4 traces
After reset: 0 traces
After re-run: 4 traces
Parameter Validation
Models now validate parameters and initial conditions by default.
[5]:
model = SIR()

# Missing parameter
try:
    model([1000, 1, 0], [0, 50], 1001, {'beta': 0.3})  # Missing gamma
except ValidationError as e:
    print(f"Validation error: {e}")
Validation error: Missing required parameters: {'gamma'}
[6]:
# Negative parameter
try:
    model([1000, 1, 0], [0, 50], 1001, {'beta': -0.3, 'gamma': 0.1})
except ValidationError as e:
    print(f"Validation error: {e}")
Validation error: Parameter 'beta' must be non-negative, got -0.3
[7]:
# Initial conditions exceed population
try:
    model([1000, 100, 0], [0, 50], 1001, {'beta': 0.3, 'gamma': 0.1})
except ValidationError as e:
    print(f"Validation error: {e}")
Validation error: Sum of initial conditions (1100) exceeds total population (1001)
Disable validation
Validation can be disabled for performance or special cases.
[12]:
# Validation disabled - no error raised
model([1000, 1, 0], [0, 50], 1001, {'beta': 0.3, 'gamma': 0.1}, validate=False)
print("No validation error with validate=False")
No validation error with validate=False
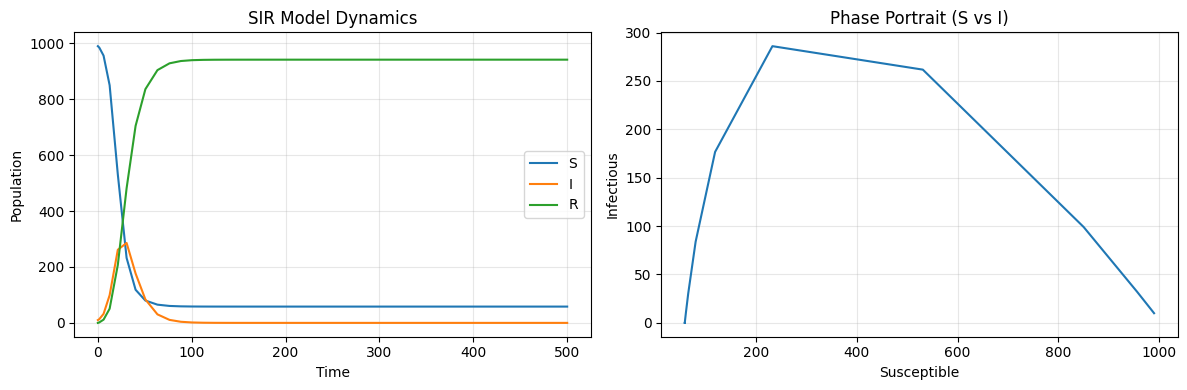
Complete Example
Let’s put it all together with a complete example.
[2]:
# Create and run model
model = SIR()
model([990, 10, 0], [0, 500], 1000, {'beta': 0.3, 'gamma': 0.1})

# Get R0
print(f"Basic reproduction number (R0): {model.R0:.2f}")

# Get summary
stats = model.summary()
print(f"\nEpidemic Summary:")
print(f"  Peak infected: {stats['peak_I']:.0f} at day {stats['peak_time']:.0f}")
print(f"  Attack rate: {stats['attack_rate']*100:.1f}%")

# Export to DataFrame
df = model.to_dataframe()

# Plot
fig, axes = plt.subplots(1, 2, figsize=(12, 4))

# Time series
df.plot(x='time', y=['S', 'I', 'R'], ax=axes[0])
axes[0].set_title('SIR Model Dynamics')
axes[0].set_xlabel('Time')
axes[0].set_ylabel('Population')
axes[0].grid(True, alpha=0.3)

# Phase portrait
axes[1].plot(df['S'], df['I'])
axes[1].set_title('Phase Portrait (S vs I)')
axes[1].set_xlabel('Susceptible')
axes[1].set_ylabel('Infectious')
axes[1].grid(True, alpha=0.3)

plt.tight_layout()
Basic reproduction number (R0): 3.00

Epidemic Summary:
  Peak infected: 286 at day 31
  Attack rate: 94.1%
[13]:
[ ]: